Why Your eCommerce Store Gets Traffic but No Sales (And How to Fix It)
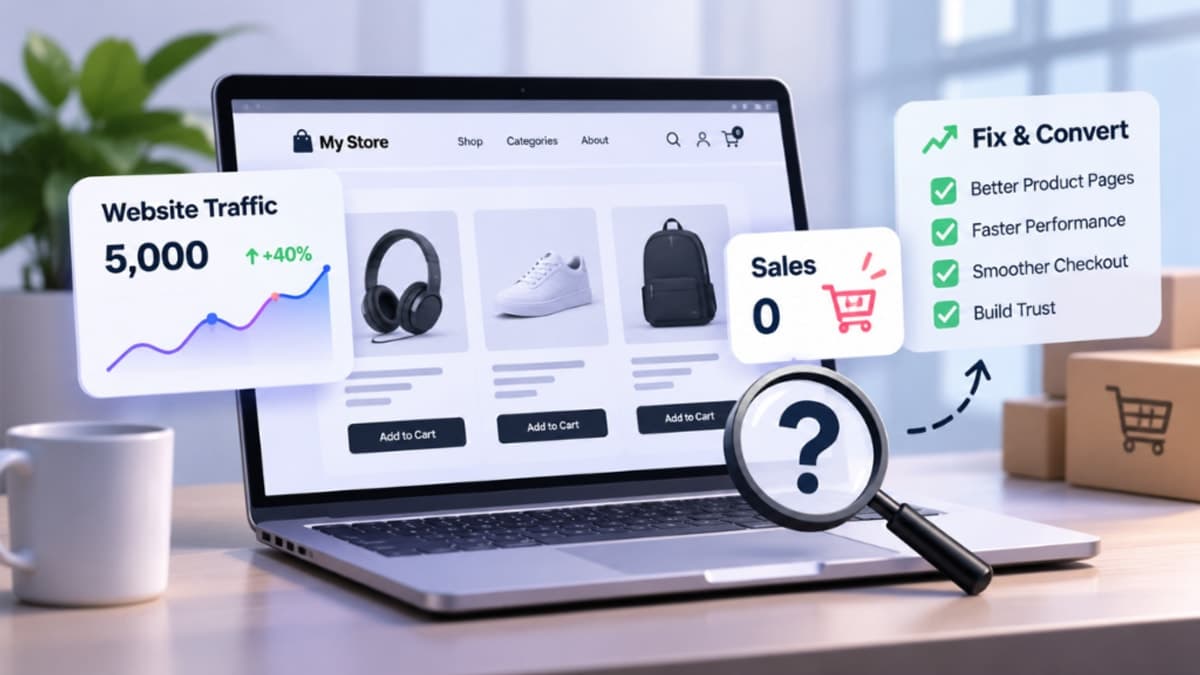
Seeing steady visitors arrive at your online store while your order notifications remain silent is one of the most frustrating challenges in digital retail. You have invested in building a store, photographing products, running ads, or improving search visibility—yet you are facing eCommerce traffic but no sales.
When shoppers visit an online store and leave without purchasing, the problem is rarely that "nobody wants the product." More often, subtle friction points along the buying journey erode confidence, create confusion, or interrupt checkout before a customer can complete their order. The encouraging news is that if your store already attracts visitors, you do not necessarily need a larger advertising budget—you need systematic eCommerce conversion optimization.
This guide explains how conversion rates work, breaks down the 12 most common reasons an online store gets traffic but no conversions, provides a diagnostic framework to pinpoint where shoppers drop off, and gives you an interactive checklist and 30-day action plan to turn existing traffic into revenue.
- •Understanding eCommerce Conversion Rates
- •1. Attracting the Wrong Traffic or Misaligned Search Intent
- •2. Unclear Value Proposition and Weak First Impressions
- •3. Confusing Store Navigation, Filters, and Site Search
- •4. Weak Product Pages That Leave Buyer Questions Unanswered
- •5. Unexpected Shipping Costs and Unclear Pricing
- •6. Missing Trust Signals, Customer Reviews, and Return Policies
- •7. A Frustrating Mobile Shopping Experience
- •8. Slow Page Load Speed and Poor Core Web Vitals
- •9. Complicated Checkout and Mandatory Account Creation
- •10. Limited or Unfamiliar Payment Options
- •11. Weak or Hidden Calls to Action (CTAs)
- •12. No Analytics Tracking or Cart Recovery Follow-Up
- •How to Diagnose Where Customers Drop Off in Your Store
- •Interactive 12-Point Conversion Optimization Checklist
- •Your 30-Day eCommerce Conversion Improvement Plan
- •Frequently Asked Questions
- •Conclusion
Understanding eCommerce Conversion Rates
Before changing your storefront design or pausing ad campaigns, it helps to understand how website traffic but no conversions is measured. In eCommerce, your conversion rate is the percentage of total store sessions that result in a completed purchase.
For example, if your online store receives 5,000 sessions in a month and generates 50 completed purchases, your store's conversion rate is 1.0%.
How eCommerce Conversion Rate Is Calculated
Standard Conversion Rate Formula
Conversion Rate = (Sessions with Purchases ÷ Total Website Sessions) × 100
5,000
Store visits in 30 days50
Orders placed at checkout1.0%
(50 ÷ 5,000) × 100 = 1%Small improvements in conversion rate have a compounding impact on business revenue without requiring additional advertising spend. Consider an illustrative store receiving 5,000 monthly sessions with an average order value (AOV) of $50. Lifting conversion from 0.5% to 2% quadruples monthly revenue from the exact same visitor count:
How Conversion Rate Improvements Multiply Revenue (Without Extra Ad Spend)
Illustrative comparison assuming 5,000 monthly website sessions and a $50 average order value (AOV).
Note: The figures above are illustrative mathematical examples (5,000 sessions × conversion rate × $50 AOV), not industry benchmark averages.
1. Attracting the Wrong Traffic or Misaligned Search Intent
Not all website traffic carries buying intent. If thousand of visitors arrive from broad social media giveaways, untargeted display ads, or purely informational blog posts unrelated to your catalog, they will leave within seconds.
Even high-intent shoppers bounce when there is a mismatch between the link they clicked and the page they land on:
- Sending specific ad clicks to a generic homepage: If a customer clicks an ad for a "Men's Waterproof Trail Running Jacket" and lands on your general homepage instead of that exact product or category page, they are forced to search for the item all over again.
- Broad or mismatched keyword targeting: Ranking for informational queries when a shopper is not looking to buy—or failing to align collection and product pages with commercial search intent through structured SEO and search optimization services.
- Geographic or audience mismatch: Running advertising campaigns that reach countries or regions where you do not offer shipping or local currency support.
Match Every Traffic Source to the Exact Destination Page
Audit your top 10 landing pages in Google Analytics. Ensure every paid ad, social link, and email campaign points directly to the specific product, collection, or curated landing page promised in the ad creative—and verify that your target audience matches your shipping regions and pricing tier.
2. Unclear Value Proposition and Weak First Impressions
When a first-time visitor lands on your store, they decide within seconds whether your brand looks credible and relevant. If your hero section displays a vague slogan like "Welcome to Our Store — Quality Redefined" over a stock photograph, shoppers cannot tell what you sell, who it is for, or why they should buy from you instead of a familiar marketplace.
A clear value proposition immediately answers three buyer questions above the fold:
- What do you sell? Clear category framing and authentic product imagery.
- Why does it matter to the customer? The specific problem solved, material quality, warranty, or specialized expertise.
- What should the visitor do next? A direct, high-contrast call to action leading to your bestselling collection or product finder.
3. Confusing Store Navigation, Filters, and Site Search
Shoppers cannot buy products they cannot find. Stores with cluttered navigation menus, vague category names, or broken collection filters frustrate buyers who are ready to purchase.
Whether your store runs on Shopify, WooCommerce, or a custom storefront, product discovery should feel effortless:
- Use clear, descriptive category labels: Replace internal jargon with familiar terms buyers actually use (e.g., "Men's Formal Shoes", "Skincare by Concern", or "Laptop Backpacks").
- Provide practical collection filters: Let shoppers filter large catalogs by size, color, price range, material, and in-stock availability so they never waste time clicking out-of-stock variants.
- Upgrade on-site search:Visitors who use your search bar often have the highest purchase intent. Ensure your search bar handles spelling variations, synonyms, and instant product previews.
4. Weak Product Pages That Leave Buyer Questions Unanswered
In physical retail, a customer can pick up an item, inspect the stitching or ingredients, check the size, and ask a store associate a question. Online, your product detail page (PDP) must do all of that work. When an online store is not making sales despite healthy product page views, thin or incomplete product information is usually the culprit.
Low-Converting Product Pages vs. High-Converting Product Pages
What shoppers need to see on a product page before they feel confident clicking 'Add to Cart'.
Thin Product Page
Leaves critical buyer questions unanswered
- A single low-resolution product photo on a plain background
- One or two generic sentences copied from a supplier catalog
- No sizing chart, dimensions, compatibility notes, or care instructions
- Unclear stock status and no indication of when the order will arrive
Conversion-Optimized Product Page
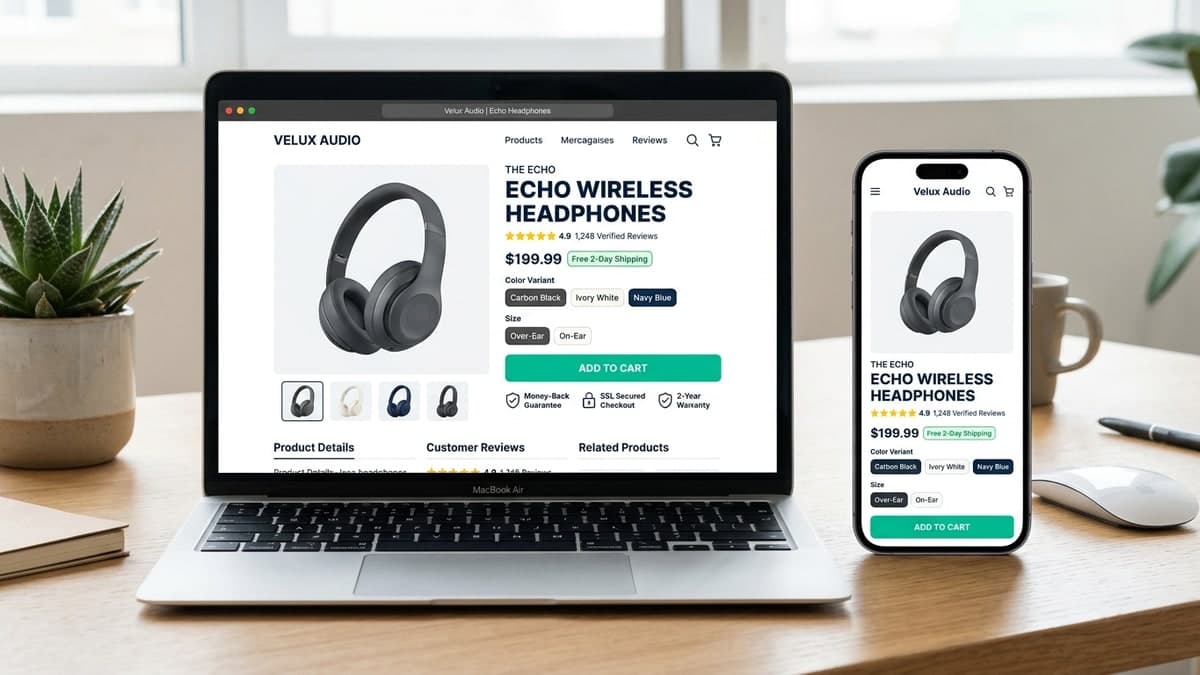
Answers objections right beside the 'Add to Cart' button
- Multi-angle & lifestyle gallery: Crisp studio shots, close-ups, scale reference, and short product video
- Benefit-driven descriptions + structured specs: Scannable bullet points covering materials, dimensions, and use cases
- Interactive sizing & fit guidance: Clear measurements and model/usage references to reduce return anxiety
- Upfront delivery & return reassurance: Estimated delivery window and return policy summary right below the CTA
5. Unexpected Shipping Costs and Unclear Pricing
One of the leading causes of cart abandonment worldwide is unexpected extra costs—shipping fees, taxes, handling charges, or currency confusion—appearing at the final checkout screen. When a shopper adds a $40 item to their cart and discovers an unexpected $15 delivery fee on the payment step, they frequently abandon the order.
How to eliminate pricing and shipping friction:
- Display shipping costs and free-shipping thresholds early: Use a clear announcement bar or product-page note (e.g., "Standard Delivery $4.95 • Free Shipping on Orders Over $60") so buyers know the total cost before entering checkout.
- Provide a shipping estimator in the cart: Allow customers to see delivery rates and estimated transit days before typing their full billing details.
- Support local currency clarity for international shoppers: If you sell cross-border—such as selling internationally from Sri Lanka to customers in the US, UK, Europe, or Australia—display prices clearly in the buyer's familiar currency and explain whether import duties are included.
6. Missing Trust Signals, Customer Reviews, and Return Policies
Every time a new customer considers buying from an independent eCommerce store, they silently ask: Is this business legitimate? Will the product look like the photo? What happens if it doesn't fit or arrives damaged?
If your website lacks visible proof of reliability, cautious shoppers will leave to buy from a better-known retailer. Build unmistakable trust across your store by implementing:
Verified Customer Reviews & Photos
Display authentic star ratings, written customer feedback, and real buyer photos on product pages so shoppers can validate quality and sizing.
Clear Return, Exchange & Refund Policies
Write a plain-English return policy explaining the return window, condition requirements, and how exchanges work—linked in both the footer and product pages.
Real Contact Information & Support Channels
Publish a physical business address, support email, phone or WhatsApp contact, and an About Us page that shows the real company behind the store.
SSL Encryption & Recognized Payment Badges
Ensure HTTPS is active across every page and display recognized payment network logos (Visa, Mastercard, Apple Pay, PayPal, or local gateways) near checkout.
7. A Frustrating Mobile Shopping Experience
For most online retailers, mobile smartphones account for the majority of store traffic—yet mobile conversion rates often lag behind desktop because merchants only test their store on a wide office monitor.
Common mobile usability issues that silently block sales include:
- Intrusive pop-ups covering the screen: Discount pop-ups, cookie banners, and floating chat buttons that overlap one another or have tiny close buttons trap mobile visitors before they can even view a product.
- Hard-to-tap variant selectors and buttons: Size buttons, quantity selectors, and navigation links placed too close together cause accidental taps.
- Add-to-Cart button pushed far below the fold: Requiring mobile shoppers to scroll through multiple screens of text before seeing the price and primary purchase button.
- Cluttered mobile checkout forms: Failing to trigger the numeric keypad for phone and card number fields or disabling mobile autofill.
8. Slow Page Load Speed and Poor Core Web Vitals
Storefront speed directly impacts both search visibility and checkout completion. When product pages lag, images load slowly, or buttons freeze while third-party scripts execute, impatient shoppers abandon the session.
Google measures real-world page experience through three Core Web Vitals metrics at the 75th percentile of page loads:
Google Core Web Vitals: Recommended Good Thresholds
Google evaluates these three real-user experience metrics at the 75th percentile of mobile and desktop page loads.
Largest Contentful Paint
Measures how quickly the largest visible content element (such as a hero banner or main product photo) finishes rendering on screen.
Interaction to Next Paint
Measures how fast the page visually responds when a shopper taps a variant selector, filter, menu, or 'Add to Cart' button.
Cumulative Layout Shift
Measures whether buttons, images, or banners shift unexpectedly while the shopper is reading or trying to tap checkout controls.
Threshold source: Google Search Central / web.dev Core Web Vitals “Good” thresholds measured at the 75th percentile of page loads.
To keep your store within Google's recommended good thresholds (LCP ≤ 2.5s, INP ≤ 200ms, and CLS ≤ 0.1), compress oversized product and banner images into modern WebP or AVIF formats, audit and remove unused third-party Shopify or WooCommerce apps that inject heavy JavaScript across every page, and work with specialists in website performance and conversion optimization.
9. Complicated Checkout and Mandatory Account Creation
Once a shopper clicks Proceed to Checkout, they have already decided they want your product. Every unnecessary form field, forced registration screen, or confusing step between the cart and payment confirmation increases the likelihood of checkout abandonment.
Proven eCommerce checkout optimization practices include:
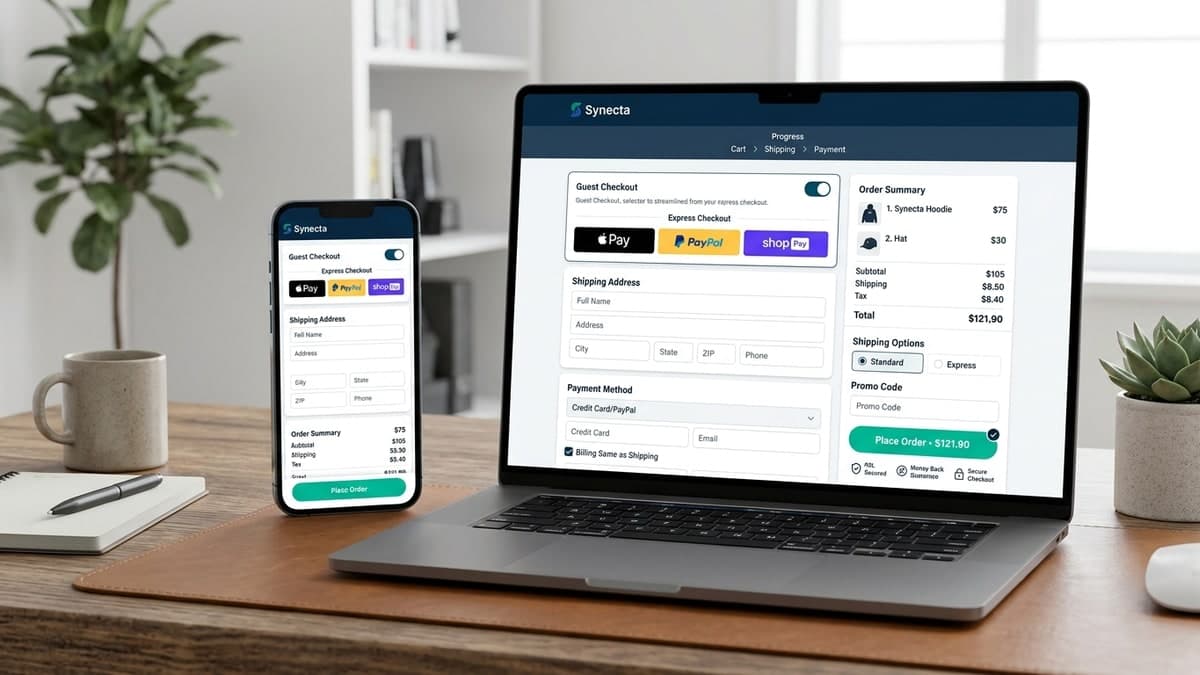
- Always offer Guest Checkout: Never force a first-time buyer to create a password and verify an email account before they can pay. Allow guest checkout and offer optional one-click account creation on the order confirmation page.
- Minimize form fields: Only ask for information required to fulfill and bill the order. Combine first and last name fields where appropriate, default billing address to shipping address, and enable address auto-complete.
- Show a clear progress indicator and order summary: Let shoppers see their selected items, variant details, promo code field, shipping cost, and total price clearly throughout checkout.
10. Limited or Unfamiliar Payment Options
A customer can reach the final step of checkout with card in hand and still abandon the purchase if their preferred payment method is missing, fails to load, or redirects to an unfamiliar external page.
Depending on your target market, properly engineered payment gateway and checkout integrations should support:
- Major credit and debit cards: Seamless Visa, Mastercard, and American Express processing with reliable 3D Secure authentication.
- Express digital wallets: Apple Pay, Google Pay, Shop Pay, or PayPal Express so mobile shoppers can check out in seconds without typing a 16-digit card number.
- Regionally trusted payment methods: For example, businesses operating on Shopify in Sri Lanka often combine approved local card gateways, installment options, or verified Cash on Delivery (COD) workflows for domestic buyers alongside international gateways for export customers.
11. Weak or Hidden Calls to Action (CTAs)
Your primary purchase buttons—Add to Cart, Buy Now, and Complete Order—should never blend into the background or compete with five other buttons of the same color.
Ensure your primary CTA button uses a high-contrast brand color, features clear action-oriented text, shows immediate visual feedback when tapped (such as opening a clear slide-out cart drawer or confirmation state), and remains easy to reach on mobile screens—including a clean sticky Add-to-Cart bar on long product pages.
12. No Analytics Tracking or Cart Recovery Follow-Up
Even on well-optimized online stores, many visitors will browse, compare prices, or add an item to their cart and get distracted before completing payment. If you do not track eCommerce funnel events or follow up with interested shoppers, those warm leads are lost permanently.
Every serious online store should implement two foundational systems through a clean digital marketing and analytics setup:
- Granular funnel analytics: Track `view_item`, `add_to_cart`, `begin_checkout`, `add_payment_info`, and `purchase` events in Google Analytics 4 (GA4) alongside heatmaps or session recordings so you can see exactly where visitors hesitate.
- Automated cart and checkout recovery: Send helpful, well-timed abandoned checkout emails or SMS messages reminding shoppers of their saved items, answering common shipping or return questions, and providing a direct link back to their pre-filled cart.
How to Diagnose Where Customers Drop Off in Your Store
Instead of guessing which of the 12 issues above is hurting your store, examine your store's conversion funnel. By comparing how many sessions view products, add items to the cart, reach checkout, and complete a purchase, you can isolate the exact stage where buyers leave.
Below is an illustrative conversion funnel for a hypothetical store receiving 10,000 monthly sessions and achieving a 2% overall conversion rate:
Illustrative eCommerce Conversion Funnel (2% Overall Conversion)
Tracking where visitors leave helps you identify whether your store has a product page problem, a cart problem, or a checkout problem.
10,000 Website Sessions
Visitors land on homepage, collections, or product pages
800 Sessions with Cart Additions
92% leave before adding an item (product page, price, or intent gap)
400 Sessions Reaching Checkout
50% of carts abandon before starting checkout (shipping cost or cart friction)
200 Sessions with Purchases
50% of checkout starters complete payment
Illustrative customer journey example: 200 purchases from 10,000 sessions = 2.0% overall store conversion rate.
Use the diagnostic table below to match your store's analytics pattern with the most likely root causes and priority fixes:
| Customer Behavior Pattern in Analytics | What It Usually Indicates | What to Investigate & Fix First |
|---|---|---|
| High bounce rate on landing pages (visitors leave within seconds) | Misaligned traffic intent, slow mobile load speed, or unclear value proposition | Check ad-to-landing-page relevance, test mobile LCP speed, and clarify above-the-fold headline & imagery |
| Visitors browse multiple categories but rarely view product pages | Confusing navigation, poor collection filtering, or unappealing product thumbnails | Simplify menu structure, add size/price/in-stock filters, and improve collection card photos & pricing clarity |
| High product page views but very low Add-to-Cart rate | Weak product descriptions, missing sizing/spec details, uncompetitive pricing, or lack of reviews | Upgrade product copy, add size guides & multi-angle photos, display verified reviews, and show shipping info upfront |
| Healthy Add-to-Cart rate but few shoppers click 'Proceed to Checkout' | Cart drawer friction, unexpected shipping calculations, or distracting cross-sell pop-ups | Make the 'Checkout' button unmistakable in the cart, show free-shipping progress, and remove intrusive pop-ups |
| Shoppers start checkout but abandon before completing payment | Surprise shipping/tax fees, mandatory account creation, payment gateway failure, or security doubts | Enable guest checkout, show upfront shipping totals, test payment gateways on mobile, and add cart recovery emails |
| Desktop converts well, but mobile traffic gets almost no sales | Mobile layout bugs, overlapping widgets, slow cellular scripts, or tedious mobile form entry | Test the entire buying journey on real iOS and Android phones, enable express wallets, and fix mobile tap targets |
Interactive 12-Point Conversion Optimization Checklist
Use this interactive checklist to audit your eCommerce store across all 12 conversion pillars. Check off items as you verify them—your progress is saved automatically in your browser:
12-Point eCommerce Conversion Optimization Checklist
Check off each area as you audit your online store. Your progress is saved automatically in your browser.
Your 30-Day eCommerce Conversion Improvement Plan
Attempting to overhaul every page of your store in a single afternoon often leads to unfinished changes. Instead, follow this structured 30-day optimization roadmap, tackling high-impact improvements week by week:
Practical 4-Week eCommerce Conversion Improvement Roadmap
A structured weekly sequence to resolve conversion blockers without overwhelming your team.
Analytics, Traffic Intent & Speed Audit
- Verify GA4 eCommerce events (view_item, add_to_cart, begin_checkout, purchase)
- Audit paid ad and organic landing pages for search and buyer intent alignment
- Test mobile load speed and Core Web Vitals (LCP, INP, CLS); remove unused app scripts
- Fix broken links, missing product variants, or mobile layout overlaps
Product Pages, Pricing Clarity & Trust
- Upgrade top 20 product pages with clear benefit-driven copy, sizing guides, and specs
- Display shipping rates, free-shipping thresholds, and delivery timelines on product pages
- Add verified customer reviews, clear return policy summaries, and trust badges near CTAs
- Improve on-site search and collection filters for size, price, and availability
Cart & Checkout Friction Removal
- Enable guest checkout so first-time buyers are never forced to create an account
- Streamline checkout form fields and enable address auto-complete
- Verify local and international payment gateways, cards, and express digital wallets
- Test the complete checkout flow on real iOS and Android mobile devices
Recovery Workflows & Ongoing Testing
- Launch automated abandoned cart and abandoned checkout email/SMS sequences
- Review heatmaps and session recordings to spot remaining mobile UX hesitation
- Compare pre-audit and post-audit Add-to-Cart and checkout completion rates
- Document winning improvements and schedule monthly conversion reviews
Whether you are optimizing a store through custom Shopify store development, refining a WordPress catalog via WooCommerce development, or modernizing your architecture through eCommerce storefront and commerce development, measuring before and after each weekly sprint ensures every change contributes to real revenue growth.
Frequently Asked Questions
Why is my eCommerce store getting traffic but no sales?
An eCommerce store typically gets traffic without sales when there is a disconnect between visitor intent and the landing page, or when shoppers encounter friction such as slow mobile load times, incomplete product descriptions, missing customer reviews, unexpected shipping costs, mandatory account creation, or limited payment options at checkout.
What is a good conversion rate for an eCommerce store?
Conversion rates vary significantly by industry, product price point, traffic source, and region. Rather than fixating on a single universal number, track your store's baseline conversion rate—calculated as (Sessions with Purchases ÷ Total Sessions) × 100—and focus on steadily improving your Add-to-Cart and checkout completion rates month over month.
How much traffic does an online store need before getting its first sale?
There is no fixed visitor threshold, because 100 highly targeted visitors searching for your exact product will convert far better than 5,000 untargeted social media clicks. However, evaluating at least several hundred qualified sessions in Google Analytics helps you see reliably whether visitors are dropping off on landing pages, product pages, or checkout.
Why do customers add products to their cart and leave without paying?
The most common reasons for cart and checkout abandonment are surprise shipping fees or taxes revealed at the last step, forced account registration, long or confusing checkout forms, slow mobile pages, lack of trust signals, or a missing preferred payment method.
Should I run more ads if my store is not converting?
No. Increasing ad spend on a store with broken product pages, slow mobile performance, or checkout friction simply magnifies wasted budget. Fix your foundational conversion bottlenecks, product page clarity, and analytics tracking first—and if your store also needs more qualified visitors, review our guide on why your eCommerce website isn't getting traffic.
Can AI tools help improve eCommerce conversion rates?
Yes, when built on top of a solid store foundation. As covered in our guide on AI in eCommerce, practical AI tools such as semantic site search, context-aware product recommendations, and 24/7 shopping assistants help shoppers find the right products and get instant answers before checkout.
Conclusion
Having eCommerce traffic but no sales is a solvable engineering and user-experience challenge. When visitors are already arriving at your store, every improvement you make to traffic alignment, product page clarity, upfront shipping transparency, mobile speed, trust signals, and checkout simplicity compounds across every future marketing campaign.
Start by auditing your analytics funnel to see where shoppers hesitate, work through the 12-point optimization checklist above, and test your store on a mobile phone just as a first-time buyer would.
Turn More Website Traffic Into Business Growth
At Synecta Digital, we help businesses build, improve, and optimize digital commerce experiences. From Shopify and WooCommerce development to website performance improvements, commerce integrations, and ongoing technical support, we create solutions designed to support sustainable business growth.
Have a commerce project in mind?
Tell us what you're building, improving, or trying to connect. Our eCommerce specialists will review your project and recommend the right implementation approach.